Data Visualization
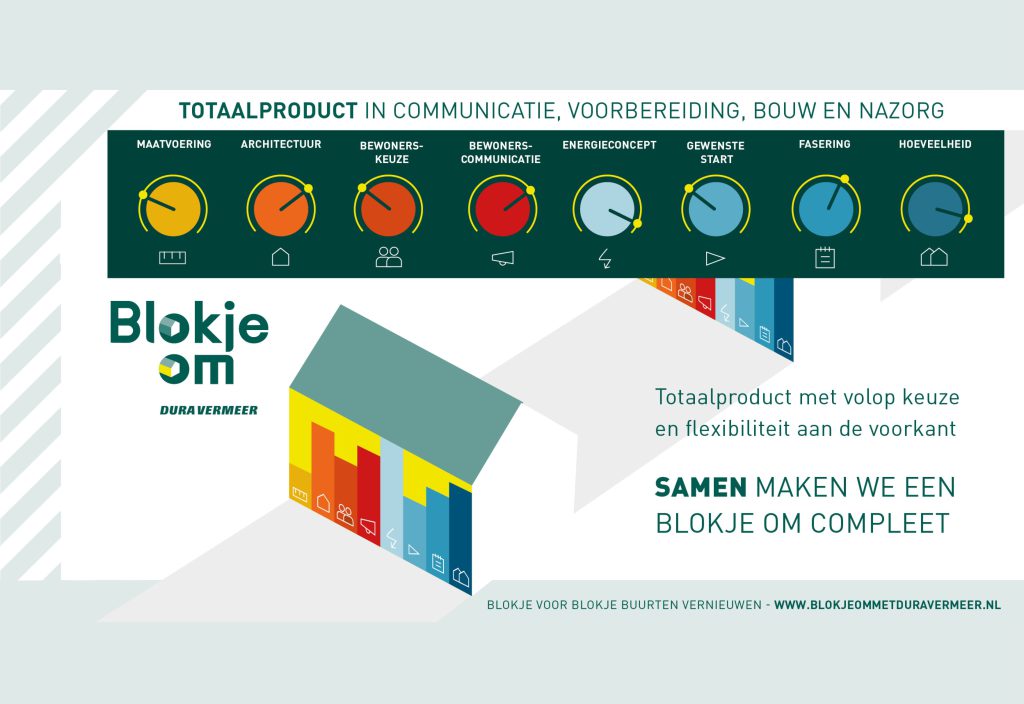
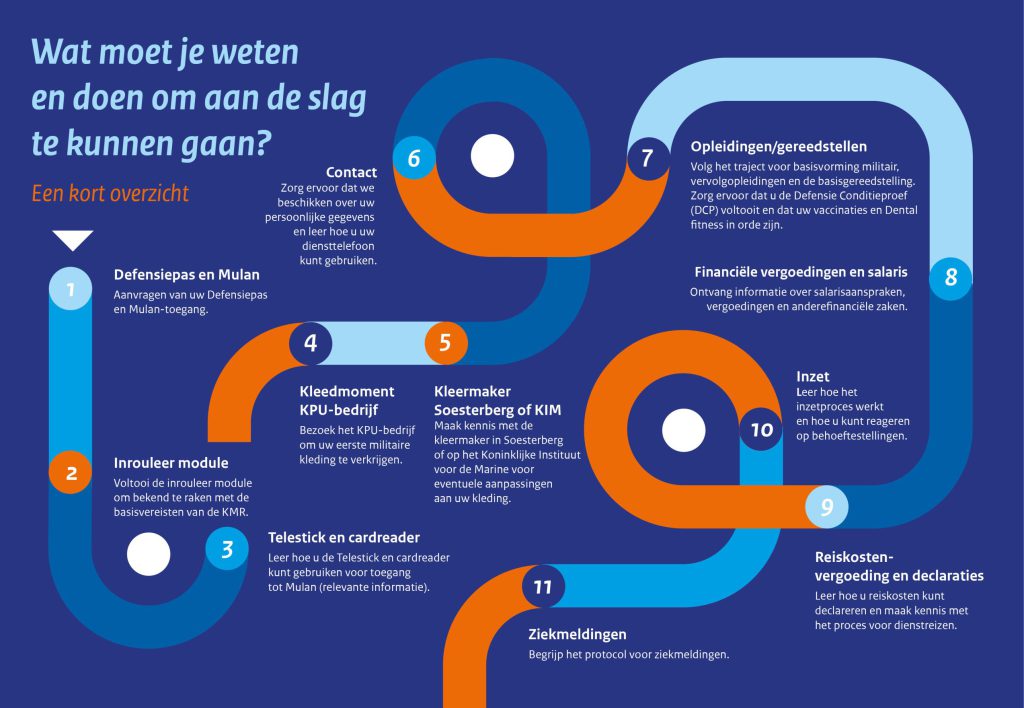
Making complex information understandable, summarizing it and presenting it in an attractive way, that’s data visualization. Also called infographic. Each one of them is a


Interested in a Collaboration?
For us, it’s all about personal contact and strong relationships. We believe in sustainable partnerships, based on trust and mutual success. That’s why we don’t talk about clients, but about partners. Ready to get acquainted?

